A golf club distance chart is the single most practical tool any golfer can use. It tells you exactly how far you carry each club so you can make confident decisions on every shot. At Madknows, we’ve pulled together the most complete golf club distance chart available – broken down by swing speed, skill level, handicap, age, and gender – plus the one distance mistake most golfers make that costs them strokes every round. Whatever your current level, your numbers are in here.
Carry Distance vs. Total Distance: Why It Matters
Most golfers confuse these two numbers – and it quietly costs them shots.
Carry distance is how far the ball travels through the air before it hits the ground. Total distance includes the additional roll after landing. When you are selecting a club on the course, carry distance is the number that matters – especially when you are flying a bunker, clearing water, or hitting into a firm green. Total distance varies enormously depending on turf firmness, slope, and weather. Carry distance is consistent.
All charts in this article focus on carry distance unless otherwise stated. This is what TrackMan, the PGA Tour ShotLink system, and Shot Scope all use as the standard for distance tracking – and it is what you should be using too.
Quick rule of thumb: On a dry, firm course, add 5–10% to carry distance for your total distance. On soft, wet turf, carry and total distance are almost identical.
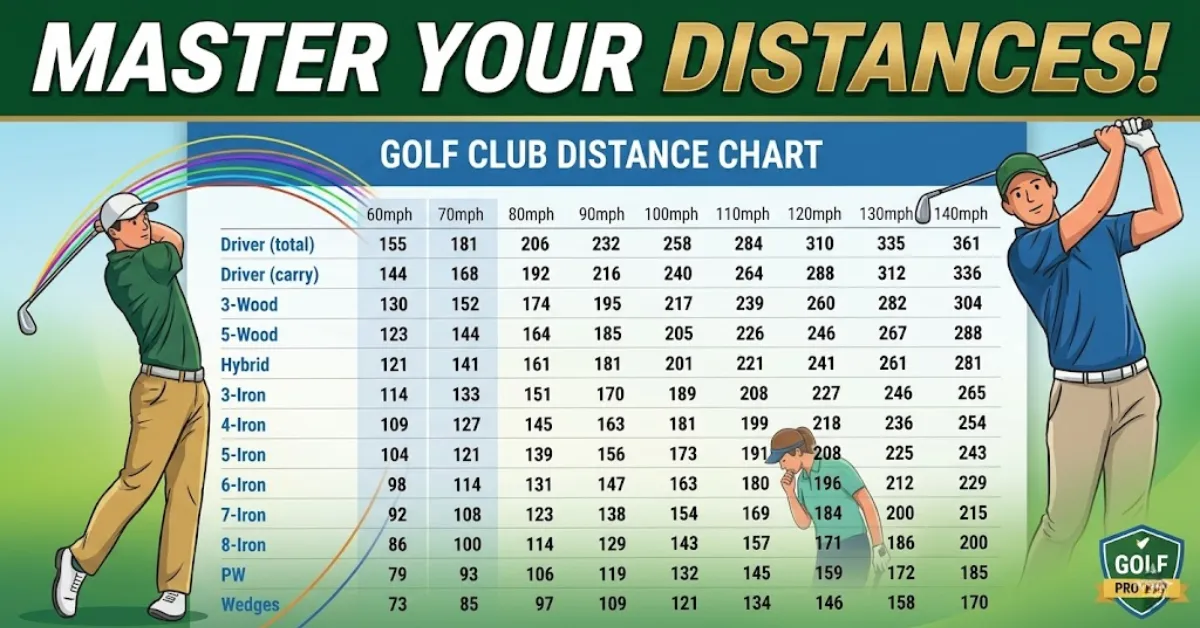
Golf Club Distance Chart by Swing Speed
Swing speed is the single biggest driver of distance. The data below is sourced from TrackMan and represents carry distances for well-struck shots at each swing speed. These are the same reference numbers used by PGA Tour fitting studios and teaching professionals worldwide.
Note: The swing speed column header refers to driver swing speed. All other club distances are estimated from that baseline.
| Club | 60 mph | 70 mph | 80 mph | 90 mph | 100 mph | 110 mph | 120 mph | 130 mph | 140 mph |
|---|---|---|---|---|---|---|---|---|---|
| Driver (Total) | 155 | 181 | 206 | 232 | 258 | 284 | 310 | 335 | 361 |
| Driver (Carry) | 146 | 170 | 195 | 219 | 243 | 268 | 292 | 316 | 340 |
| 3 Wood | 130 | 150 | 175 | 195 | 215 | 238 | 259 | 283 | 303 |
| 5 Wood | 125 | 145 | 165 | 185 | 205 | 225 | 245 | 265 | 285 |
| Hybrid | 120 | 140 | 160 | 180 | 200 | 220 | 240 | 260 | 280 |
| 3 Iron | 115 | 130 | 150 | 172 | 188 | 207 | 226 | 245 | 265 |
| 4 Iron | 110 | 126 | 145 | 165 | 180 | 199 | 208 | 226 | 245 |
| 5 Iron | 105 | 120 | 138 | 155 | 170 | 185 | 198 | 215 | 228 |
| 6 Iron | 100 | 115 | 130 | 145 | 165 | 175 | 185 | 195 | 208 |
| 7 Iron | 95 | 105 | 120 | 135 | 155 | 165 | 175 | 185 | 195 |
| 8 Iron | 85 | 100 | 115 | 130 | 145 | 155 | 165 | 175 | 190 |
| 9 Iron | 80 | 90 | 105 | 120 | 130 | 145 | 160 | 175 | 186 |
| Pitching Wedge | 73 | 85 | 100 | 110 | 120 | 135 | 145 | 156 | 167 |
Source: TrackMan carry distance data. Distances in yards.
Average Golf Club Distances for Men, Women, and Seniors
Distance varies significantly based on age, gender, and skill level. The numbers below reflect real-world averages from the Arccos Driving Distance Report (2025) and Shot Scope’s database of over 40 million tracked amateur shots.
Men (Amateur Average): The average male amateur golfer carries the driver 224.7 yards (Arccos 2025) — not the 230-yard figure you will often see quoted on older charts. The 7 iron typically travels 140–155 yards for the average male golfer.
Women (Amateur Average): The average female amateur generates a driver swing speed of around 65–75 mph. Average driver carry distance is approximately 150–175 yards, with the 7 iron averaging 100–120 yards.
Seniors (Male, 60+): Senior male golfers average around 196–212 yards with the driver depending on age bracket (Arccos & Shot Scope data). The 7 iron typically travels 125–145 yards.
Golf Club Distance Chart by Handicap Level
Swing speed is useful, but most golfers think in terms of their handicap. Here is a complete carry distance breakdown by handicap bracket, based on Shot Scope data from millions of real amateur rounds.
| Club | Scratch (0–4) | 5–14 Handicap | 15–24 Handicap | 25+ Handicap |
|---|---|---|---|---|
| Driver | 250–270 yds | 220–245 yds | 195–220 yds | 170–195 yds |
| 3 Wood | 230–245 yds | 200–220 yds | 175–200 yds | 150–175 yds |
| 5 Iron | 195–215 yds | 170–190 yds | 150–170 yds | 130–150 yds |
| 7 Iron | 170–185 yds | 145–165 yds | 125–145 yds | 105–125 yds |
| 9 Iron | 140–155 yds | 115–135 yds | 100–120 yds | 85–100 yds |
| Pitching Wedge | 125–140 yds | 100–120 yds | 85–105 yds | 70–90 yds |
Source: Shot Scope. All figures are carry distances in yards.
The USGA average male handicap index sits just above 14.2. This means most male golfers reading this should focus on the 5–14 or 15–24 column — not the professional or scratch benchmarks that dominate most online distance charts.
Golf Club Distance Chart for Seniors
Swing speed naturally decreases with age — typically by 1–2 mph per year after age 50 as fast-twitch muscle fibres reduce. But that does not mean seniors cannot play accurate, strategic golf. Here are realistic carry distance expectations for male and female senior golfers.
| Club | Male Senior (55–65) | Male Senior (65+) | Female Senior (55–65) | Female Senior (65+) |
|---|---|---|---|---|
| Driver | 195–215 yds | 175–195 yds | 145–165 yds | 125–145 yds |
| 5 Wood | 175–195 yds | 155–175 yds | 130–150 yds | 110–130 yds |
| 7 Iron | 140–155 yds | 125–140 yds | 100–115 yds | 85–100 yds |
| 9 Iron | 110–125 yds | 100–115 yds | 80–95 yds | 65–80 yds |
| Pitching Wedge | 95–110 yds | 85–100 yds | 70–85 yds | 55–70 yds |
Senior equipment tip: Consider moving to a senior-flex shaft and a higher-lofted driver (12°–14°) to maximise launch angle and recover the carry distance lost through lower swing speed. Many senior golfers also benefit from switching long irons to hybrids, which are far easier to get airborne at slower swing speeds.
Women’s Golf Club Distance Chart
The average female amateur golfer generates a driver swing speed of around 65–75 mph, compared to 93 mph for the average male amateur (Arccos 2025). Women’s LPGA Tour players average 94 mph — nearly identical to the average male amateur — which explains why the distance gap between LPGA and male amateur golfers is far smaller than most people assume.
| Club | Low Handicap (0–10) | Mid Handicap (11–20) | High Handicap (21+) |
|---|---|---|---|
| Driver | 200–225 yds | 165–200 yds | 135–165 yds |
| 3 Wood | 180–200 yds | 150–175 yds | 120–150 yds |
| 5 Iron | 145–165 yds | 120–145 yds | 95–120 yds |
| 7 Iron | 120–140 yds | 100–120 yds | 80–100 yds |
| 9 Iron | 95–115 yds | 80–100 yds | 65–80 yds |
| Pitching Wedge | 80–100 yds | 70–90 yds | 55–70 yds |
Swing Speed Charts by Age and Gender
| Age | Men (Average Driver Swing Speed) | Women (Average Driver Swing Speed) |
|---|---|---|
| 10–16 years | 93 mph | 83 mph |
| 17–29 years | 113 mph | 93 mph |
| 30–50 years | 103 mph | 85 mph |
| 50–60 years | 99 mph | 74 mph |
| 60+ years | 93 mph | 73 mph |
Driver Swing Speed Chart by Golf Skill Level
| Skill Level | Swing Speed | Driver Carry Distance |
|---|---|---|
| Beginner | 80 mph | 185–195 yds |
| Average Amateur | 94 mph | 215–225 yds |
| Good Amateur | 100 mph | 235–245 yds |
| Scratch Golfer | 110 mph | 260–270 yds |
| PGA Tour Average | 114 mph | 275–285 yds |
| Women’s Average | 77 mph | 155–175 yds |
| LPGA Tour Average | 94 mph | 210–220 yds |
What is Smash Factor?
Smash factor is the ratio of ball speed to clubhead speed. It measures how efficiently your club transfers energy to the ball at impact. A higher smash factor means a more efficient strike — more of your swing speed actually moves the ball.
Formula: Ball Speed ÷ Clubhead Speed = Smash Factor
Example: 150 mph ball speed ÷ 100 mph swing speed = 1.50 Smash Factor
Ideal Smash Factor by Club
| Club | Ideal Smash Factor |
|---|---|
| Driver | 1.48–1.50 |
| Fairway Woods | 1.42–1.46 |
| Long Irons (3–4) | 1.38–1.42 |
| Mid Irons (5–7) | 1.33–1.38 |
| Short Irons (8–PW) | 1.28–1.33 |
The key takeaway: hitting the ball from the centre of the clubface is the fastest route to more distance. Even a modest improvement in strike quality — hitting the sweet spot more consistently — produces more yardage than adding 5 mph of swing speed with off-centre contact.
How to Swing the Club Faster
If you want to push your distances up the chart, here are three proven methods:
1. Work with a swing coach on technique. The correct motion maximises the speed you already have. A good coach helps you hit the ball from the correct spot on the clubface consistently, which can add the equivalent of 5–10 mph to your effective swing speed without physically swinging faster.
2. Build golf-specific strength and flexibility. Exercises that target rotational power — core strength, hip mobility, and shoulder flexibility — directly increase clubhead speed. Golfers who commit to a structured programme over 3–6 months regularly see gains of 5–15 mph. A qualified fitness trainer with golf experience is worth the investment.
3. Switch to a lighter shaft. Replacing a heavy steel shaft with a lighter graphite option can add 2–5 mph to your swing speed with no technique change at all. This is especially effective for seniors and golfers with slower swing speeds.
Ball Speed to Clubhead Speed Chart: Driver
| Ball Speed (mph) | 110 | 120 | 130 | 140 | 150 | 160 | 170 | 180 | 190 | 200 |
|---|---|---|---|---|---|---|---|---|---|---|
| Clubhead Speed (mph) | 77 | 84 | 91 | 98 | 104 | 111 | 118 | 125 | 132 | 138 |
| Driver Carry (yds) | 181 | 198 | 214 | 231 | 247 | 263 | 280 | 296 | 313 | 329 |
What Swing Speed Do You Need to Hit 250 Yards?
To carry the driver 250 yards, most golfers need a swing speed of approximately 95–100 mph, combined with solid, centred contact. At a smash factor of 1.49, a 98 mph swing speed produces roughly 146 mph of ball speed — enough to carry approximately 248–255 yards under normal conditions.
Is a 250-yard drive good? Absolutely. The average male amateur carries the driver 224.7 yards (Arccos 2025), meaning a 250-yard carry puts you comfortably above the field.
Ball Speed to Clubhead Speed: 7 Iron
The average smash factor for a 7 iron is approximately 1.33 — lower than the driver because shorter clubs transfer energy differently. This means your 7 iron swing speed and your driver swing speed are not the same number.
| Driver Swing Speed | 7 Iron Carry Distance |
|---|---|
| 60 mph | 95 yds |
| 70 mph | 105 yds |
| 80 mph | 120 yds |
| 90 mph | 135 yds |
| 100 mph | 155 yds |
| 110 mph | 165 yds |
| 120 mph | 175 yds |
| 130 mph | 185 yds |
| 140 mph | 195 yds |
What swing speed hits a 7 iron 150 yards? A driver swing speed of approximately 95–100 mph, combined with solid ball striking, will typically produce a 7 iron carry of 145–155 yards.
Golf Club Distance Charts: Key Factors Beyond Swing Speed
Loft
Every club is built with a specific loft angle that determines how high and far the ball flies. More loft means higher trajectory and shorter distance. Less loft means lower flight and more distance — but only if you have the swing speed to compress the ball at that loft.
Modern golf club manufacturers have progressively reduced iron lofts over the past 30 years. A 7 iron in the early 1990s typically had a loft of 38–40 degrees. Today’s equivalent sits at 28–32 degrees. This is one reason golfers today carry irons further than previous generations — but it also means like-for-like comparisons across sets are misleading.
| Club | Average Loft (2025) | Average Loft (1990) |
|---|---|---|
| Driver | 8°–13° | 9°–14° |
| 3 Wood | 13°–15° | 15°–17° |
| 5 Wood | 20°–23° | 21°–24° |
| 3 Iron | 21°–24° | 23°–25° |
| 4 Iron | 25°–28° | 28°–30° |
| 5 Iron | 28°–31° | 31°–33° |
| 6 Iron | 32°–35° | 35°–37° |
| 7 Iron | 29°–32° | 39°–41° |
| 8 Iron | 36°–40° | 43°–47° |
| 9 Iron | 41°–45° | 48°–50° |
| Pitching Wedge | 44°–48° | 51°–54° |
If your swing speed is below 80 mph, low-lofted irons will be very difficult to get airborne. Fairway woods (15°–19°) and hybrids are far more effective options for golfers in that swing speed range.
How Conditions Affect Your Golf Club Distances
Your chart numbers are baselines. Real-world conditions shift every single number — and understanding those shifts is what separates smart course management from guessing.
Wind: A 10 mph headwind reduces carry distance by approximately 5–10 yards on a full iron shot and 10–15 yards with the driver. A tailwind adds a similar amount. Play for it — one club longer into a headwind is not overcooking it, it is correct.
Temperature: Cold, dense air creates more drag on the ball. In temperatures around 40°F (4°C), expect carry distances to drop by 5–8 yards compared to a warm summer round. On a cold winter morning, club up.
Altitude: Thinner air at elevation means less drag. At 5,000 feet above sea level — Denver, Johannesburg, parts of the UAE desert — add 8–10% to your normal carry distances. Many golfers are caught off guard by this on golf trips.
Turf Firmness: Soft, wet turf kills roll, making carry distance nearly equal to total distance. Firm, dry fairways add 10–20 yards of run to a mid-iron shot. In links-style conditions, the difference between carry and total can exceed 25 yards on iron shots.
How to Find Your Own Golf Club Distances
Generic charts are a starting point — but your personal numbers are what win rounds. Here are the three most reliable ways to build your own distance card.
1. Launch Monitor Session A launch monitor — TrackMan, Foresight GC Quad, or FlightScope — gives you exact carry distance, ball speed, and launch angle for every club. Most golf retailers and teaching professionals offer 30–60 minute sessions. Even one session gives you accurate carry numbers for the whole bag.
2. GPS Watch or Shot-Tracking App Devices like Garmin Approach and apps like Arccos Caddie automatically log your shot distances across multiple real rounds. After 5–10 rounds, you have highly reliable personal averages built from actual shots on actual courses — not driving range balls hit under ideal conditions.
3. The Driving Range Method Hit 10 balls with each club on a range with marked yardage flags. Remove the two longest and the two shortest. Average the remaining six. That is your working carry distance for that club. Repeat every few months as your swing develops.
Golf Club Distance Chart in Meters
For golfers outside the United States, or those playing courses marked in meters, here is a carry distance conversion chart for the average male amateur golfer.
| Club | Yards (Average) | Meters (Average) |
|---|---|---|
| Driver | 225 yds | 206 m |
| 3 Wood | 205 yds | 187 m |
| 5 Wood | 185 yds | 169 m |
| Hybrid | 180 yds | 165 m |
| 5 Iron | 170 yds | 155 m |
| 7 Iron | 150 yds | 137 m |
| 9 Iron | 125 yds | 114 m |
| Pitching Wedge | 110 yds | 101 m |
| Sand Wedge | 90 yds | 82 m |
To convert yards to meters, multiply by 0.9144.
Golf Club Distance Charts of PGA Tour Golfers
PGA Tour players operate in a different world. The current PGA Tour average driver distance is 300.5 yards (TrackMan / PGA Tour 2025) — a figure that has risen dramatically over the past two decades and continues to climb. For context, the average male amateur carries the driver 224.7 yards, meaning the gap between professional and amateur driving distance is now over 75 yards.
| Club | PGA Tour Average | Bryson DeChambeau | Dustin Johnson | Rory McIlroy | Jack Nicklaus (Era) | LPGA Tour Average |
|---|---|---|---|---|---|---|
| Driver | 300 yds | 330 yds | 312 yds | 315 yds | 250 yds | 255 yds |
| 3 Wood | 275 yds | 295 yds | 282 yds | 295 yds | 235 yds | 230 yds |
| 5 Wood | 255 yds | 275 yds | 267 yds | 270 yds | 220 yds | 215 yds |
| 5 Iron | 210 yds | 235 yds | 225 yds | 230 yds | 195 yds | 175 yds |
| 7 Iron | 185 yds | 210 yds | 200 yds | 205 yds | 175 yds | 153 yds |
| 9 Iron | 160 yds | 178 yds | 172 yds | 178 yds | 148 yds | 130 yds |
| Pitching Wedge | 148 yds | 162 yds | 158 yds | 165 yds | 136 yds | 118 yds |
Why Are Modern Golfers Longer Than Prior Generations?
The distance explosion in professional golf over the past 30 years comes down to three interconnected factors.
Physical Fitness
Modern tour professionals treat their bodies as athletic equipment. Structured gym programmes, physio support, nutritional planning, and swing-speed-specific training are now standard on every major tour. This is a significant departure from previous generations — the era of Arnold Palmer and Jack Nicklaus was one where professionals regularly smoked on the course and had little access to formal athletic conditioning. Tiger Woods changed that culture permanently when he entered the professional game in the late 1990s in peak athletic condition. The generation of golfers he inspired has carried that standard forward. Bryson DeChambeau’s deliberate physical transformation between 2019 and 2021 — during which he added significant muscle mass to increase swing speed — is the most dramatic recent example of this principle taken to its extreme.
Club Advancements
The loft reduction of modern irons is one of the most significant — and least discussed — contributors to increased distance. A 7 iron in the early 1980s typically had a loft of 39–41 degrees. Many modern 7 irons sit at 28–32 degrees. That 8–12 degree reduction alone accounts for 20–30 extra yards on a well-struck shot. Driver technology has also transformed with the move to large-head titanium and carbon composite designs that allow golfers to hit up on the ball and reduce spin, which dramatically increases carry.
Golf Ball
The introduction of multi-layer urethane-covered golf balls — led by the Titleist Pro V1 in 2000 — fundamentally changed how far the ball travels. Modern balls fly straighter, spin less off the driver, and carry further than the wound balata balls used by professionals prior to 2000. The distance gains from ball technology have become significant enough that the governing bodies — the USGA and R&A — introduced the new Model Local Rule limiting ball distance performance at the highest levels of the professional game, effective January 2026.
Frequently Asked Questions: Golf Club Distances
The average male amateur golfer carries a 7 iron approximately 145–155 yards, based on Shot Scope data from millions of tracked shots. Female amateurs average 100–120 yards with the same club. Golfers with a 15–24 handicap typically carry the 7 iron 125–145 yards, while scratch golfers carry it 170–185 yards. A wide range — which is why knowing your own numbers matters more than any chart average.
Carry distance is how far the ball travels through the air before landing. Total distance includes the roll after it lands. Carry distance is what matters for club selection — especially when hitting over hazards or into greens — because roll varies with turf firmness, slope, and weather. All professional distance-tracking systems (TrackMan, Shot Scope, Arccos) report carry distance as the primary metric.
Beginner golfers typically carry the driver 165–195 yards, depending on swing speed and how consistently they make solid contact. A 185-yard drive in the fairway beats a 210-yard drive in the rough every time at this stage of development. Accuracy and contact quality matter far more than raw distance when you are learning the game.
The most accurate method is a launch monitor session at a golf retailer or teaching facility — these give you carry distance, ball speed, and spin rate for every club. A GPS shot-tracking app like Arccos Caddie builds your personal distance averages over real rounds automatically. The simplest low-tech method: hit 10 balls per club at a range with distance markers, drop the two shortest and two longest, and average the remaining six.
Most golfers need a driver swing speed of approximately 95–100 mph to carry the ball 250 yards, assuming solid contact and a reasonable launch angle. At a 1.49 smash factor, a 97 mph swing speed produces around 145 mph of ball speed — enough to carry approximately 245–255 yards in normal conditions.
The current PGA Tour average driving distance is 300.5 yards (TrackMan / PGA Tour 2025). This figure has risen significantly from the 280s of the early 2010s, driven by improved launch conditions, ball technology, and the physical training revolution in professional golf.
Cold air is denser than warm air, creating more drag on the ball in flight. In temperatures around 40°F (4°C), most golfers lose 5–8 yards per club compared to a warm summer round. In very cold conditions (below 35°F / 2°C), losses of 10–12 yards per club are common. Club up in the cold — your chart numbers are warm-weather baselines.
Conclusion
Understanding your golf club distance chart is one of the simplest ways to drop strokes without changing anything about your swing technique. Know your carry distances, understand how conditions affect them, use the handicap and age charts to find your realistic baseline, and you will make smarter club selections on every hole. For more practical guides covering equipment, technique, and course management, explore the full library at Madknows — and take these distance numbers to the course with confidence.